Organizing your workday
Your organization offers an overgrowing pallet of services. Customers of your organization rely increasingly on specialists who are capable and willing to manage their requests. Large international teams, mall decentralized offices and agile teams with many roles per individual: All of these require flexible, reliable and self-sufficiency. Znuny's Agent Dashboard, is the start of a well-organized day.
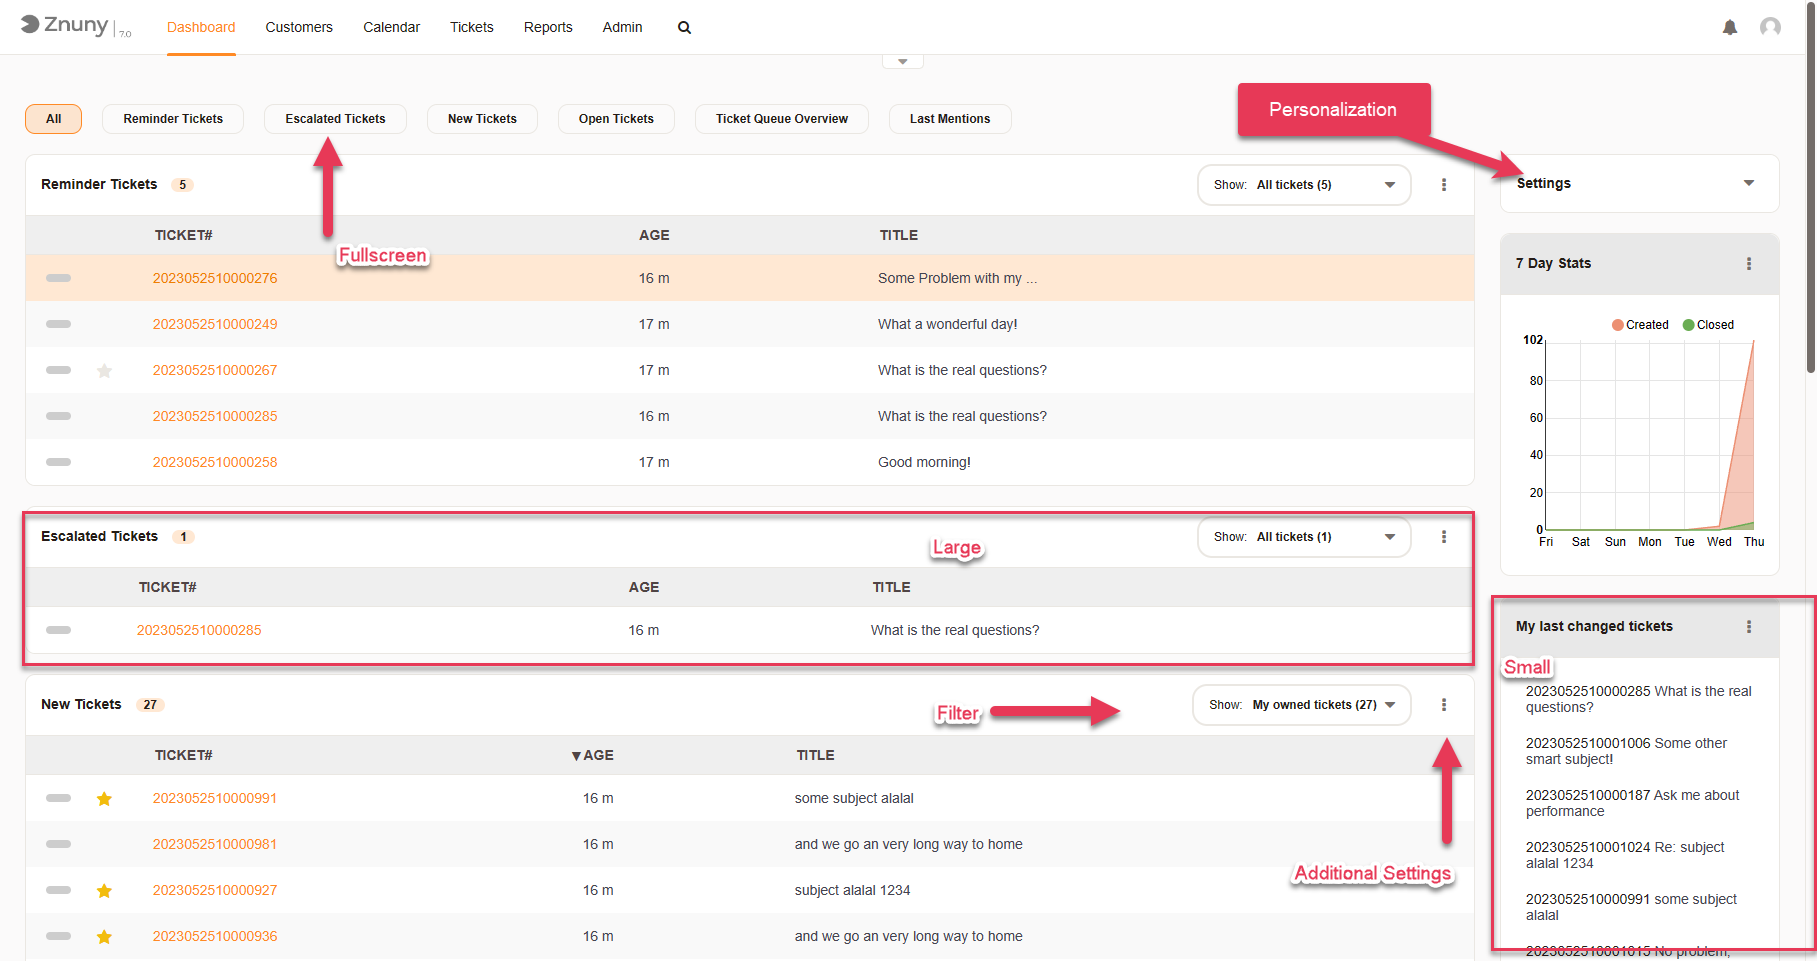
The Agent Dashboard is a feature that offers summary information about tickets in the system.

The default dashboards which are available within the system are pre-filtered tickets for which the user has read write permissions on. Default dashboards include:
- Open
- New
- Pending
- Escalated
- Last mentions
There are dashboards of different types:
- Large
- Small
Note: The user can also make the dashboards full screen, to focus on a certain area.
The available dashboards can be selected or deselected in the personalization menu, and can be dragged top to bottom. Because of their content, they are locked to the left or right side and cannot be dragged in these directions.
Each available widget can be filtered by the user based on scope and configuration. Here are a few scopes.
- My locked
- My owned
- My queues
Each widget has some additional settings, as well.
A good setup, will aid you in getting into the flow. You may decide to address escalated issues in your selected services, then move on to your pending tasks, followed up by open tickets in your queues. Watching the list of tasks counts down to zero, and clearing your dashboard can be a satisfying way of quantifying your work and helps keep you in focus. Move your dashboard elements around frequently, based on your workload and focus. Use the filters to change your scope for a specific dashboard, and extend your personalization by changing the additional settings for more columns and pagination.
